NISRA publish weekly death statistics and also provide a summary which includes excess deaths based on a 5-year average, 2017-2021.
However, our analysis will compare this to the 5-year average of 2015-2019, as these were the most recent ‘normal’ years prior to Covid and prior to the severe restrictions applied across the health service since March 2020.
The ONS takes a different approach of calculating a 5-year average as they use the years 2016-2019 & 2021, that’s despite the significant excess deaths experienced during 2021, and the restrictions that remained across the health services that year.
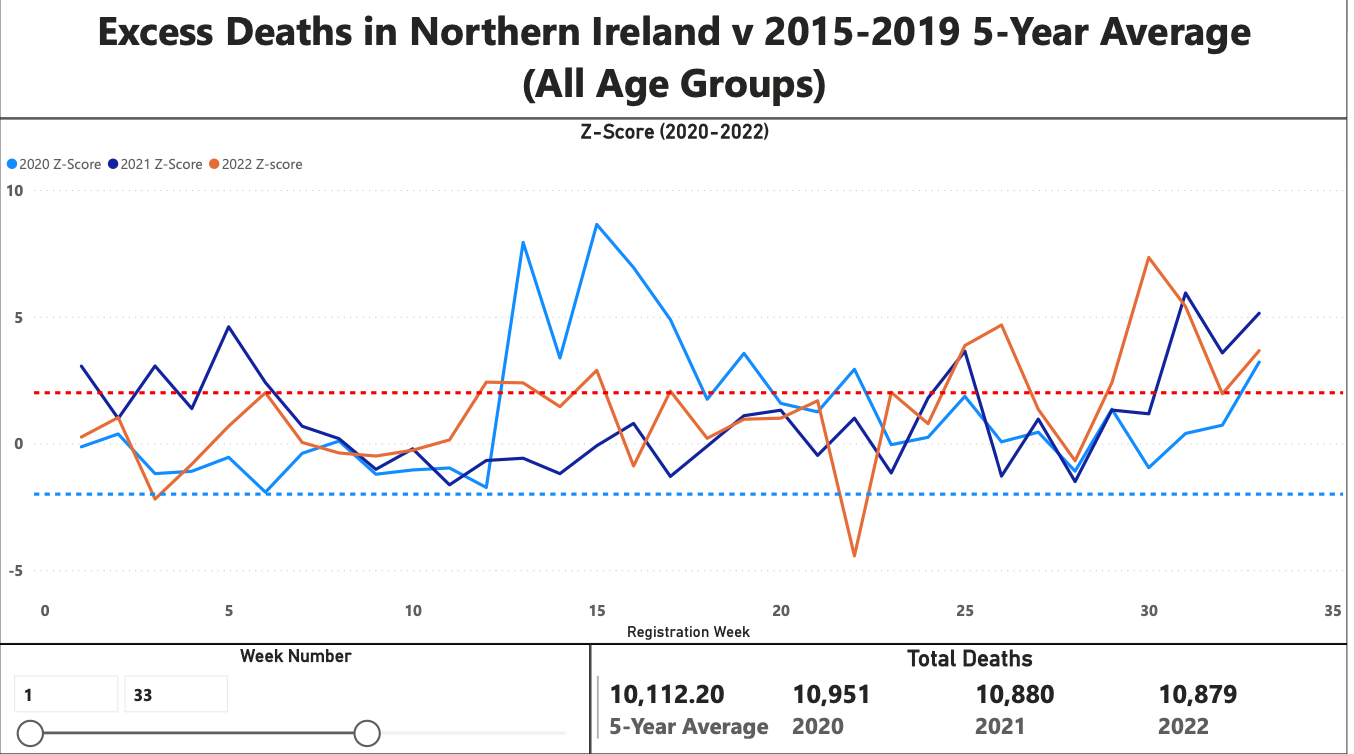
The following charts display the excess death positions of 2020, 2021 & 2022 against the 5-year average, up to and including week 33, the latest report produced by NISRA.
The red and blue dashed lines across the y-axis indicate a z-score of +2 and -2 respectively, and anything above or below the ranges are statistically significant increases or decreases in deaths compared to the 5-year average.
This is a summary of the reports for week 33:
| Age Groups | Summary Points for Year 2022 |
| All Age Groups (Slide 1) | – Year to date excess deaths v 5-year average – 767 (7.59%) – Week 33 – 57 excess deaths (21.67%) – 2022 within total death ranges of 2020 & 2021. 72 fewer than 2022 (0.66%) & 1 fewer than 2021 (0.01%). – Statistically significant excess deaths in 11 weeks year to date. |
| Ages 0 – 14 (Slide 2) | – Year to date, below the 5-year average by 17 ( -18.7%) – Week 33 – below 5-year average by 3 (-75%) |
| Ages 15 – 44 (Slide 3) | – Year to date, below the 5-year average by 18 (-4.89%) – Week 33 – 4 excess deaths (33.3%) – 2022 below death rates in 2020 & 2021. 65 fewer than 2020 (-15.7%) & 95 fewer than 2021 (-21.4%) |
| Ages 45 – 64 (Slide 4) | – Year to date excess deaths v 5-year average – 69 (4.98%) – Week 33 – 30 excess deaths (85.6%) – 2022 below death rates in 2020 & 2021. 56 fewer than 2020 (-3.7%) & 86 fewer than 2021 (-5.58%) – Statistically significant excess deaths in 7 weeks year to date. |
| Ages 65 – 74 (Slide 5) | – Year to date excess deaths v 5-year average – 108 (6.19%) – Week 33 – 7 excess deaths (15.9%) – 2022 within total death ranges of 2020 & 2021. 5 fewer than 2020 (-0.27%) & 17 above 2021 (0.93%) – Statistically significant excess deaths in 6 weeks year to date. |
| Ages 75-84 (Slide 6) | – Year to date excess deaths v 5-year average – 255 (8.83%) – Week 33 – 1 below 5-year average deaths (-1.37%) – 2022 slightly below total death ranges of 2020 & 2021. 74 fewer than 2020 (2.3%) & 92 fewer than 2021 (-2.85%) – Statistically significant excess deaths in 5 weeks year to date. |
| Ages 85+ (Slide 7) | – Year to date excess deaths v 5-year average – 370 (10.18%) – Week 33 – 21 above 5-year average deaths (22.34%) – 2022 above total death ranges of 2020 & 2021. 127 above 2020 (3.28%) & 268 above 2021 (7.17%) – Statistically significant excess deaths in 6 weeks year to date. |
| Summary | – Excess Deaths are captured in the over 45’s age groups. – Over 45’s year to date excess deaths v 5-year average – 802 (8.31%) – Under 45’s year to date, below 5-year average by 36 (-7.84%) |
Location of deaths up to and including Week 33:
| Location of Deaths | Number of Deaths Year to Date | Percentage of Total |
| Hospital | 5000 | 45.96% |
| Home | 3498 | 32.15% |
| Care Home | 1823 | 16.67% |
| Hospice | 267 | 2.45% |
| Other | 291 | 2.67% |