DOH AND NISRA PUBLISH HOSPITAL STATISTICS FOR 2020/21 SHOWING SIGNIFICANT REDUCTION IN HOSPITAL ACTIVITY DURING THE PANDEMIC.
On the 5th August 2021, the Department of Health and NISRA publish “Hospital Statistics – Inpatient and Day Case Activity Northern Ireland” and “Northern Ireland Hospital Statistics: Emergency Care” covering the period 1st April 2020 to 31st March 2021. The publications present information on inpatient and day case activity at Health and Social Care Trusts and attendances at emergency care departments in Northern Ireland respectively.
The publications can be viewed here:
- Hospital Statistics – Inpatient and Day Case Activity Northern Ireland
- Northern Ireland Hospital Statistics: Emergency Care
What makes the reports so interesting is that they cover the period which includes the first and second “waves” of the Covid-19 pandemic, in the spring of 2020 and later in the Autumn/Winter of 2020/21.
Firstly, we’ll look at some of the highlights and data from the Inpatient and Day Case activity report:
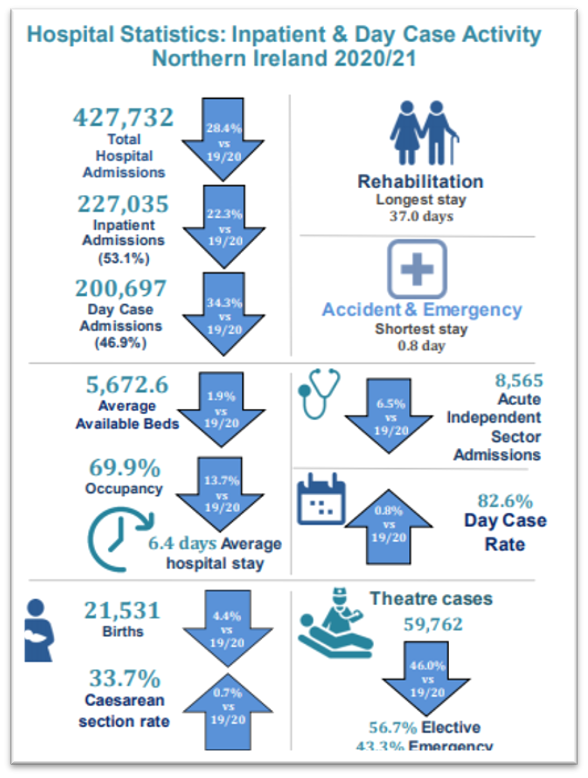
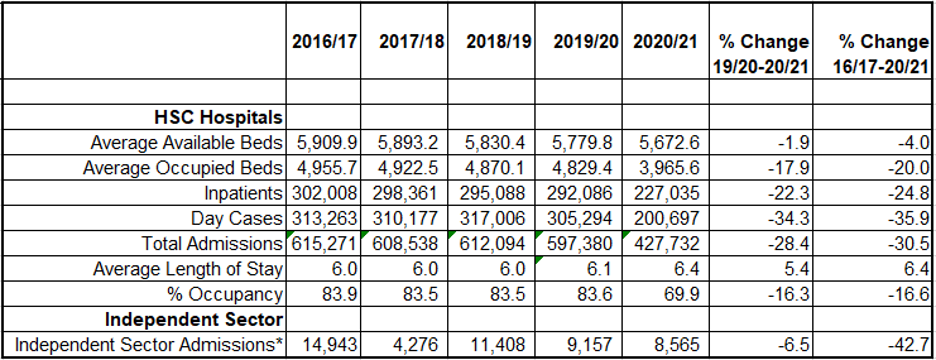
All Programmes of Care
Acute Services
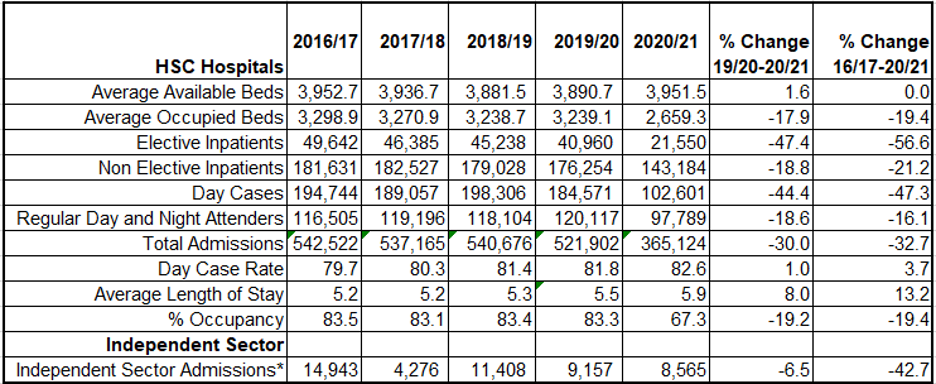
The above graphic and tables clearly display a very large reduction in hospital activity during the pandemic period, most notably under the column “% Change 19/20-20/21” the 28.4% reduction of total admissions in all programmes of care, and a 30% reduction in total admissions in Acute Services, which contain the departments tackling the Covid-19 pandemic. It is also important to note that in acute services, under the “% Occupancy” row the average bed occupancy is low compared to previous years at 67.3%, when in 2019/20 it was 83.3%.
Could this lower activity be offset against higher activity in the emergency departments for the same period? Let’s take a look at the Emergency Departments data to find out:
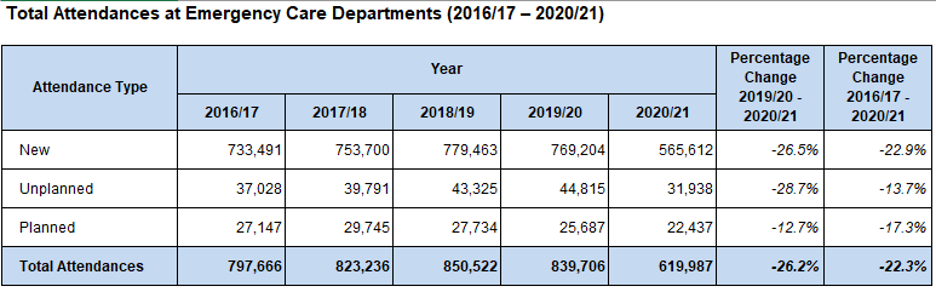
The answer is no, again, the total attendances for 2020/21 is significantly lower by 219,719 (26.2%) compared to the previous year.
How can this be? Since the beginning of the first lockdown on 23rd March 2020, we were ordered to “Stay Home”, “Save Lives” & “Protect the NHS”. But with numbers as low as this when compared to previous years, what were we protecting them from when the hospitals appear to never have been overrun with patients? Something doesn’t add up.
The second lockdown commenced in Northern Ireland on the 16th October 2020, and soon after we were hit with headlines from the media of our hospitals operating at over 100% of their capacity.
“Hospitals in Northern Ireland operating over 100% Capacity amid recent surge in Covid-19 cases”
“Seven of NI’s hospital are currently operating at more than 100 per cent capacity – 11 Covid-19 related deaths recorded in last 24 hours”
“Eight of NI’s 12 hospitals beyond capacity as Robin Swann warns ‘decisive action’ needed”
Headlines such as this do not correlate with the data published in the Hospital Statistics document.
In an attempt to provide additional context, and to give the benefit of the doubt, I extracted the data used by the Department of Health to publish the 31st March 2021 version of their Covid-19 Dashboard, so I could compare the same timelines as the Hospital Statistics document. The version and the data can be found here.
For the purpose of this comparison, the acute services information from the Hospital Statistics will be focused on rather than all programmes of care.
In acute services, there were 365,124 total admissions recorded in 2020/21, 156,778 fewer than the previous year, and according to the Covid-19 dashboard, there were 9191 Covid-19 hospital admissions (2.5% of the total admissions) up to and including 31st March 2021. Taking into account there was an overall reduction of admissions in acute services of 30%, the 2.5% extra Covid-19 patients wouldn’t seem to have made a major impact.
The Covid-19 dashboard breaks down the bed occupancy into General Beds, and ICU. I analysed the General Bed Occupancy first, which gave the following summarised statistics:
- Average number of general beds available – 3299
- Average number of general beds occupied – 2764
This suggests that the available beds are adequately covering the number of patients in hospital.
However, that initial analysis doesn’t tell the full story as on the 19th October 2020 (The first week day after the second lockdown commenced) the DoH oddly, and suspiciously, changed the way they calculated bed occupancy. I compared the periods Pre 19th October, to 19th October onwards, which showed the following:
Pre 19th Oct:
- Average number of general beds available – 3661
- Average number of general beds occupied – 2796
Post 19th Oct:
- Average number of general beds available – 2837
- Average number of general beds occupied – 2725
In graph format it looks like this:
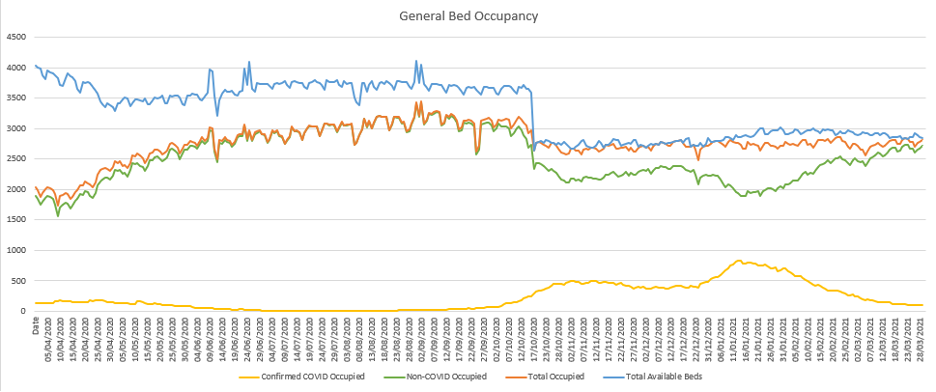
The “new method” of calculating the bed occupancy reduces the number of available beds, bringing it closer in line with the number of beds occupied and thus brings the percentage of occupied beds closer to 100%. This raises some questions:
- Was this done deliberately at the beginning of the second lockdown by the DoH so their Covid-19 dashboard would present a higher percentage of occupied beds, and therefore an attempt to justify the lockdown to the public?
- Was this a genuine reduction in available bed capacity?
- Why wait until now to highlight the reduction now a new wave and lockdown was commencing?
- What was the cause of the reduction in availability? Healthy medical staff forced to isolate due to test and trace policy?
- Why is their a lack of transparency from the Swann-lead DoH?
The 19th October is very convenient timing to use the new calculation method as, using percentage of bed occupancy, it presents the idea the health service is under more strain than before. However, the data doesn’t show an increase in number of total patients admitted.
What is also strange, is the new calculation method was not adopted in the creation of the Hospital Statistics document, which presented the average number of acute services beds as 3951, which was a 1.6% increase compared to the previous year.
A contributing factor to the pressures and strain felt by the health service could be due to staff isolation policy, as detailed in this BBC report:
“Coronavirus: More than 2,700 NI health workers are self-isolating”
RTE also reported the issue further into the second wave:
“At present, 629 staff are absent across Northern Ireland’s health trusts due to Covid-19.
A further 826 staff are recorded as absent due to self-isolation and the two groups include 494 nurses or midwifery staff.”
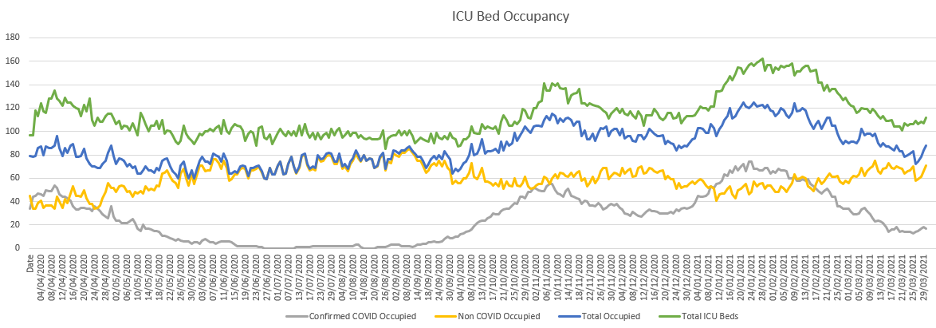
In the graph above, there is a visible increase in ICU occupancy, including numbers of Covid-19 patients. But to add context the numbers were not huge, ICU occupancy peaked at 125 patients, 72 of which were recorded as Covid-19.
What is clear, from October 2020 onwards, there isn’t an attempt to increase the number of available general beds despite the public being persistently told the health service was under strain. Perhaps they were not really needed due to much lower patient numbers compared to previous years? Robin Swann appears to agree when he returns £90 million of Covid-19 response funds to Westminster:
“Health service in Northern Ireland to hand back £90m in the midst of pandemic, says Robin Swann”
So, we had far fewer patients, much lower hospital activity across the board, and a Health Minister who couldn’t find a way to spend £90 million during a pandemic. What has caused the “immense pressure” suffered by the health service, if as the data shows, it wasn’t due to an increase in patients being admitted to hospital?